
Introduction
Usually pandas library is used for data handling in python. Noise free data is very difficult to find. Because most of the cases we don’t collect data by our selves. Even if we collect data by our selves from the field, there is always a chance to make error during collection or typing data. The people who handles data frequently, they know that how annoying and time consuming it is to clean and filter data. Perhaps we should perform data cleaning before doing any kind of analysis on it. Today I will talk about some of my experience of filtering and cleaning time series data.
Data set
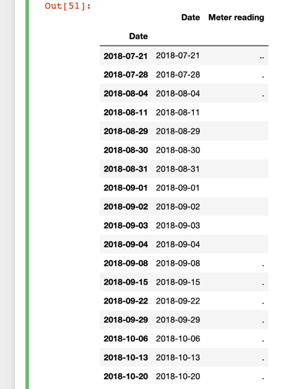
For today’s topic, I have taken a very small chunk of data from my actual observe data collected from a site of my current work. As everybody is familiar with the Microsoft excel I have saved 5 months of data in a excel file. The actual data consist of 9 columns of data. For the simplicity I have taken only one column. perhaps the example data consist of a water volume meter reading and a date column. Portion of the data if show in the figure below. I will be using python language and pandas library for data filtering and noise cleaning.
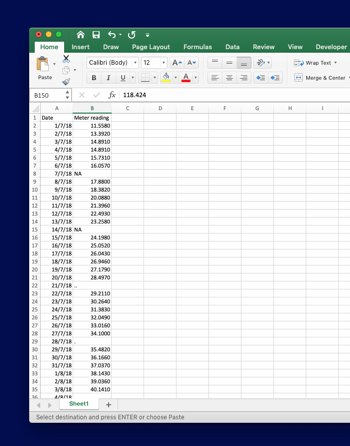
As you see, the data is consist of some noise. Which I have put it intentionally. So I have an idea about the noise in the data. But in practical case, we normally don’t have any idea about the noise. Most of the cases the noise are string. So this tutorial would be great help to some of you. Ok lot of talking. Let’s start the actual stuff.
The noise I have put in the data are ‘NA’, dot ( ‘.’), double dot (’..’) and some white spaces (‘ ’). White space is a great danger in data sheet. Because you cannot see these. But during the time of analysis, the script will produce some error or simply the script will not run.
Importing packages
Numpy, Pandas and os packages have been imported.
import numpy as np
import pandas as pd
import os
Loading the data
Loading the excel file by pandas library of python.
binpath = '/Users/....../....../......./'
fn_name = os.path.join(binpath, 'example df.xlsx')
df = pd.read_excel(fn_name)
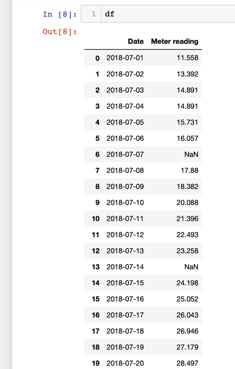
After loading the data the dataframe would be like this below.
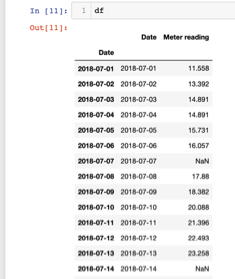
It is important for time series data that the index column should be the Date. During the data loading it can be done. It can also be done after loading of the data.
df.set_index(df['Date'], inplace=True)
After that the dataframe would be like this below.
Cleaning the data
You must have noticed that, the ‘NA’ entries from the data sheet is automatically detected and replace by ‘NaN’. So the ‘NA’ noise is already cleared by pandas. For the other noise, we will use ‘applymap’ method of pandas to know which entries are real number and which entries are not.
df.iloc[:,[1]].applymap(np.isreal)
The code above will generate the dataframe below-
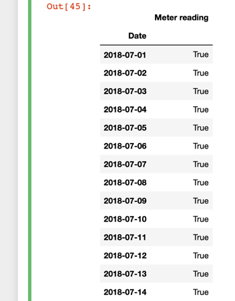
In this dataframe we get only two entries ‘True’ and ‘False’. The ‘False’ entry refers that the data in that cell is not number. It is good that we found all ‘True’ and ‘False’ values. Perhaps we are only concerned about the ‘False’ values. So, we have to save the previous Dataframe of ‘True’/ ‘False’ values for further operation. The code below will do that.
df_ms1 = df.iloc[:,[1]].applymap(np.isreal)
df[df_ms1['Meter reading']==False]
The code above will produce the part of the actual data sheet which only have noises.
Now you see that the all the noise values including white space, dot and double dot and the corresponding date. So, now we can either manually edit the excel sheet or the line of code below will only edit the imported dataframe of pandas not the actual excel sheet.
df[df_ms1['Meter reading']==False]=np.nan
All the filtering above can be done in one line of code, which is the beauty of python. For the learning and simplicity purpose I have showed the simple way. The one line filtering is shown below.
df[df.iloc[:,[1]].applymap(np.isreal['Meter reading']==False]=np.nan
This is a very simple example to start data cleaning by pandas library in python. You can also visit my other post about linear regression with pandas library if you want to explore more about pandas. In addition, there are numerous advance resources available on the internet. If anyone want to know about in depth data cleaning you can visit this blog name Real Python. You can also check out my fiverr gig about data analysis. The link is given below.
https://www.fiverr.com/hasanbdimran/manipulate-and-analyse-data-using-python